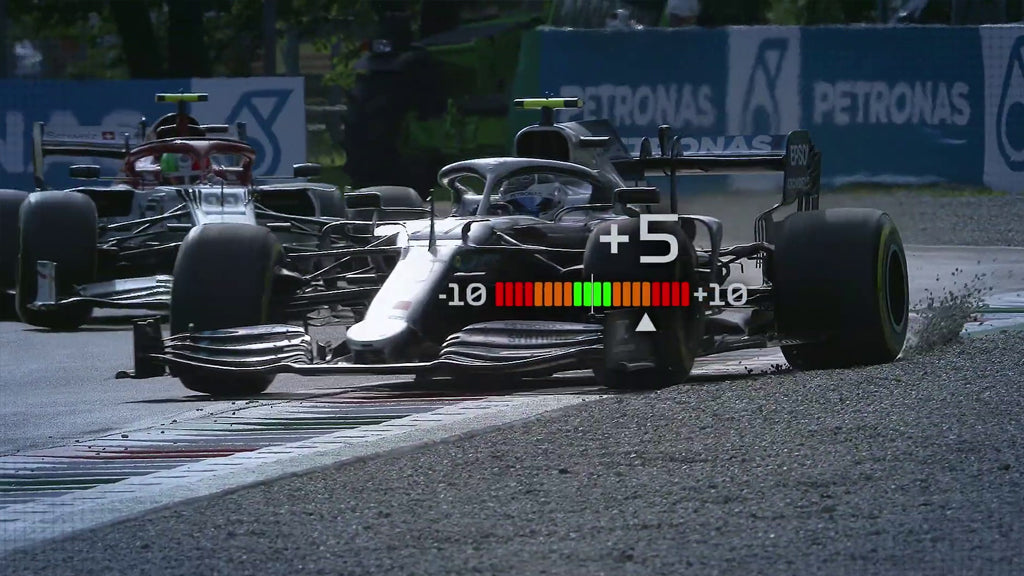
 Excited for the return of F1 in less than 2 weeks? Other than having tight racing back on the road, we are also excited for the all-new on-screen graphic that is set to make its debut at the Austrian Grand Prix on July 3-5.
 The ‘Car Performance Scores’ graphics will display live information that compares different cars’ performance throughout the lap in real time, based on low-speed cornering, high-speed cornering, straight line performance and car handling. All these data are gathered from the 300 sensors placed on each F1 car, generating over a million data points per second, which is then relayed to the pits.
 With that, we can now enjoy five additional new graphics which will feed the fans watching never-before-seen insights into the on-track action which will be rolled out gradually.

- Ultimate Driver Speed Comparison
- This will compare their favourite driver on track to other drivers in history, dating back to 1983. This graphic will debut on August 7-9 at the 70th Anniversary GP at Silverstone

- High-Speed/Low-Speed Corner Performance
- Drivers have their own style on tackling corners and this feature will show fans how well the drivers the fastest and slowest corners on the track. The graphic will make its debut on August 28-30 at the Belgian GP

- Driver Skills Rating
- This breaks down and score driver skills to identify the best ‘total driver’ on the track, based on multiple factors such as qualifying performance, starts, race pace, tyre management and overtaking /defending styles, to provide an overall ranking. This will debut in the second half of the season.

- Car/Team Development & Overall Season Performance
- A summary of how the team did throughout the season. This will debut also on the second half of the season

- Qualifying and Race Pace Prediction
- Data from practice and qualifying laps will be used to predict which team is set to perform best during qualifying and race. This is set to debut on the second half of the season
 We sure hope that F1 could implement these new features as soon as possible as not only it will make the races far more interesting, it also makes keeping up to date with the current season easier than before. From all the five graphic features, which is the one you are most looking forward to?
https://www.youtube.com/watch?v=sHOYB7AwPJ0&

